

For a while now, I’ve been dealing with some persistent network issues at one of our client sites. Full disclosure: I am nowhere near a networking expert (this is actually my first IT job), but I’m trying to be proactive, learn, and solve this :)
Our network topology looks roughly like this:
-
UDM SE as the main gateway/router.
-
USW Pro 48 PoE switch directly connected to the UDM SE.
-
USW Pro Aggregation hanging off the USW Pro 48.
-
All other switches and APs connect directly to the USW Pro Aggregation.
We are experiencing network inconsistencies that cause micro-drops. These drops occasionally cause certain applications—specifically our ERP system and access to local file shares—to lose connection. After running multiple tests and analyzing data (with some help from Gemini), I dug into the following:
I accessed the CLI of the USW Pro 48 (the switch connected to the UDM SE) to check Flow Control. I found that on one of the LACP member ports linking to the Aggregation switch, there are a massive number of transmitted PAUSE frames.
I logged these frames over a 16-hour window, and the USW Pro 48 sent 21,611,569 PAUSE frames to the Aggregation switch—which works out to roughly 375 frames per second if my math is correct. I also noticed that on the USW Pro 48, a printer is connected to a port with Flow Control enabled, and that port is receiving about 30 PAUSE frames per second.
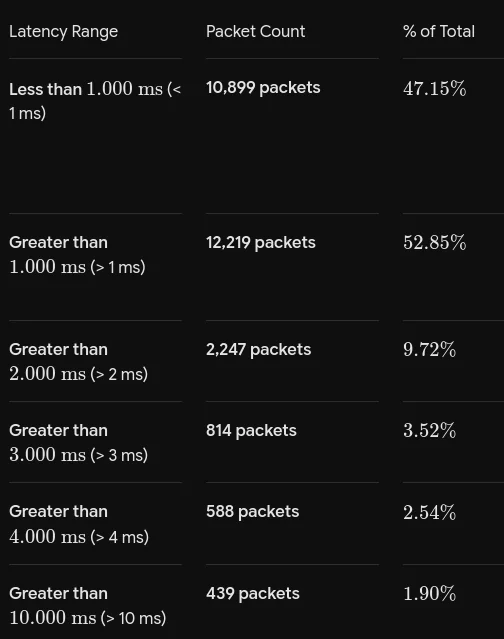
I ran continuous pings from the USW Pro 48 to the Aggregation switch. The latency frequently exceeds 1 ms. Correct me if I’m wrong, but for a short-distance fiber link, I feel the latency should consistently be sub-millisecond.
Here is a breakdown table of the ping statistics:
Additionally, the ping logs frequently exhibit behavior like this snippet:
[12:12:48] 64 bytes from 192.168.19.101: seq=1697 ttl=64 time=1.022 ms
[12:12:50] 64 bytes from 192.168.19.101: seq=1698 ttl=64 time=9.946 ms
[12:12:50] 64 bytes from 192.168.19.101: seq=1699 ttl=64 time=1.064 ms
As you can see, the timestamp skips a second (from :48 straight to :50), but the ICMP sequence number (seq) remains in perfect order without dropping. My understanding is that the PAUSE frame literally paused the frame in the buffer, causing it to be delayed and then flushed together with the next packet.
Finally, a user reported a disconnection from the ERP system. I cross-referenced the timestamp with my ping capture and found this exact event right before the report:
[12:48:55] 64 bytes from 192.168.19.101: seq=3863 ttl=64 time=1.030 ms
[12:49:13] 64 bytes from 192.168.19.101: seq=3864 ttl=64 time=17091.673 ms
[12:49:13] 64 bytes from 192.168.19.101: seq=3879 ttl=64 time=2368.089 ms
This 17-second freeze occurred just 2 minutes before the user reported the app crashing.
Now, my questions:
-
Is this massive amount of PAUSE frames between switches normal, or is it a symptom of an underlying issue (like bufferbloat or misconfiguration)? Also, shouldn’t the USW Pro Aggregation switch sit directly behind the UDM SE as the core switch, rather than having the USW Pro 48 in front of it?
-
Is it normal for a network printer port to receive ~30 PAUSE frames per second? Should Flow Control even be enabled on edge device ports like printers?
-
Are these ping anomalies (second skips, buffer flushes, and 17-second freezes) directly tied to this excessive PAUSE frame / Flow Control behavior?
Thanks in advance, I hope this makes sense!
You must log in or register to comment.